
Research, Planning & Institutional Effectiveness
Student Outcomes
Measures of students success and outcomes are continually produced for the use of planning and program development. Las Positas College measures student success using the following measures. Success and persistence data measure the rate of student successful completion of courses and completion of a sequence of courses, respectively. Successful student outcomes are assessed through analysis of the degrees/certificates earned and transfer rates to four-year institutions
SEE Also: PROGRAM REVIEW DATA PACKETS AND COURSE SEQUENCE DATA
Jump to Page Section:
Course Success Rates
(Updated 8/18/25)
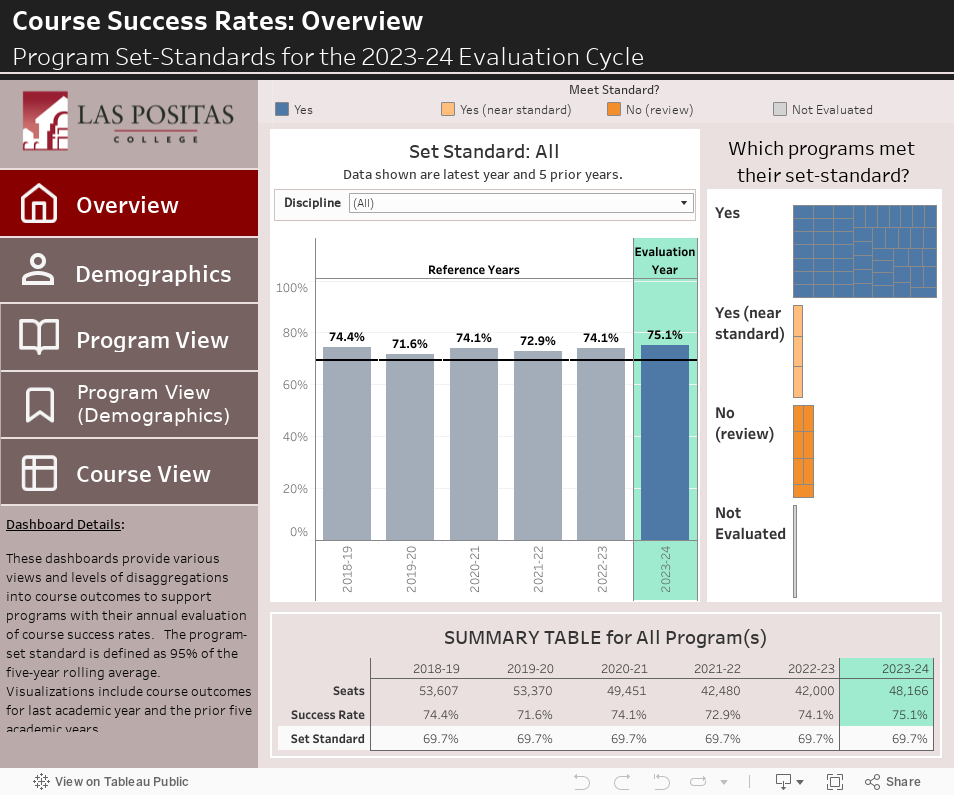
Program-Set Standards for Course Success Rates
- LATEST (For the 2025-26 Evaluation Cycle):
- Use to Assess the AY 2024-25: PDF | Tableau Dashboard
NOTE: The Program-Set Standard is defined as 95% of the 5-year rolling average.
- PAST Evaluation Cycles: AY 2023-24 | AY 2020-21 | AY 2017-18 | AY 2014-15
- Retention Rates by Demographics: AY 2020-2021
Detailed Reports: Course Success Rates by Course
- All LPC Courses (Annualized): AY 2019-20 to AY 2024-25
- Courses with Distance Education Offerings:
- Summer Semesters (2019 to 2024)
- Fall Semesters (2019 to 2024)
- Spring Semesters (2020 to 2025)
NOTE: These reports includes only courses with at least one section offered in a Distance Education format.
Degrees and Certificates Outcomes
(Updated: 10/2/25)
Award Counts (All Awards Conferred)
Overall TrendS
- Degrees and Certificates Awarded:
Detailed: By Major
- Degrees Awarded
- Certificates of Achievement Awarded
- Non-Credit Certificates Awarded
- Career Certificates Awarded
Graduates Select Demographics (Unduplicated Headcount)
Transfer Outcomes
Transfer Volume
- Latest Data:
- Overall: Transfers to UC/CSU Systems: 2013-14 to 2023-24*
- by Univerisity/Campus: Transfers to UC/CSU by University Campus: 2013-14 to 2023-24*
- Transfer by Majors:
- Overall: Transfers to UC/CSU Systems: 2013-14 to 2023-24*
- Sources:
- University of California: UC Information Center
- California State Univerisity: Statistical Reports
Transfer Rates and Success
- Transfer Rates by Entering Cohorts:
- CSU Graduation Rates of California Community College Transfers by Institution of Origin: Fall 2007