Drone Technology
Drones & Viticulture

Agricultural Analysis
UAS are increasingly being used to measure crop health and document agricultural land topography as they provide an alternative cost-effective, data-rich, and rapid form of remote sensing. Unlike their predecessors that primarily capture satellite-level imagery of large geographic areas, the more affordable and compact fixed-wing and multi-copter units available today fly at low altitudes and capture high-resolution multispectral images of smaller agricultural areas. This micro remote sensing allows for various agricultural indexes to be created from multispectral data. Rather quickly crop managers can assess plant health and observe biomass change overtime.

Monthly Flyovers
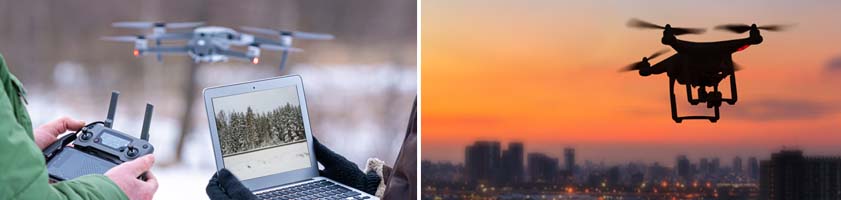
Once a month we fly a preprogrammed flight over the vineyard using a multi-spectral camera. In contrast to the normal camera that captures a single image, it takes five simultaneous images from five separate sensors, each capturing a certain wavelengths.
- Blue (475 nm center, 32 nm bandwidth),
- Green (560 nm center, 27 nm bandwidth),
- Red (668 nm center, 14 nm bandwidth),
- Red Edge (717 nm center, 12 nm bandwidth),
- Near-Infrared (NIR) (842 nm center, 57 nm bandwidth)

Our goal is to become fluent in data acquisition and analysis to the point where we can answer the following research questions:
- What is the overall health of the vineyard?
- Why are certain areas similar to or different from others?
- What characteristics are most important to measure to evaluate these similarities and differences?
The Vineyard
The Las Positas College Viticulture and Winery Technology program farms its own, 4-acre, hillside estate vineyard and is one of the few bonded wineries at a Californian institution of higher education. The Campus Hill Vineyard can be likened to an ideal experimental island. It is a relatively compact location with a diverse suite of characteristics with differences in grape varieties; topographic features; row orientation;trellis technique; and irrigation methods.
The Data
After post-processing the images using photogrammetry software, analysis is performed in geospatial software. This software allows us to visualize the growth over time and create agricultural indexes which help us understand the health of the plants at a given time.
Detailed Report


Daniel Cearley
Office 21156 - Building 2100 (First Floor)
(925) 424-1203
dcearley@laspositascollege.edu
Current Weather Conditions
Las Positas Weather Station
Program Affiliations
Check us out on Instagram!
